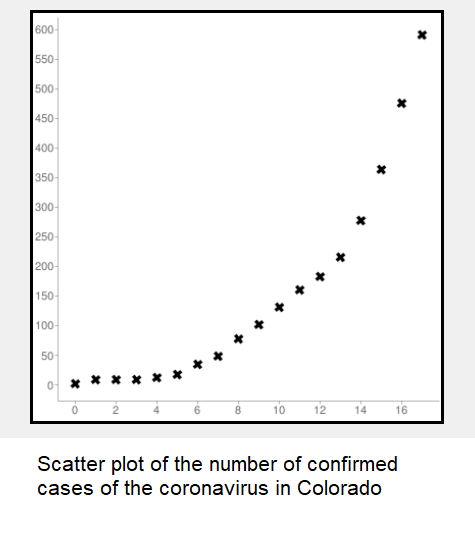
After viewing graphs of the number of confirmed cases of the coronavirus in China and the U.S. ( Click here to see the graphs), I wondered if the cases in Colorado followed a similar pattern.
Here is the data for the first eighteen days from March 5, 2020 to March 22, 2020 in Colorado:
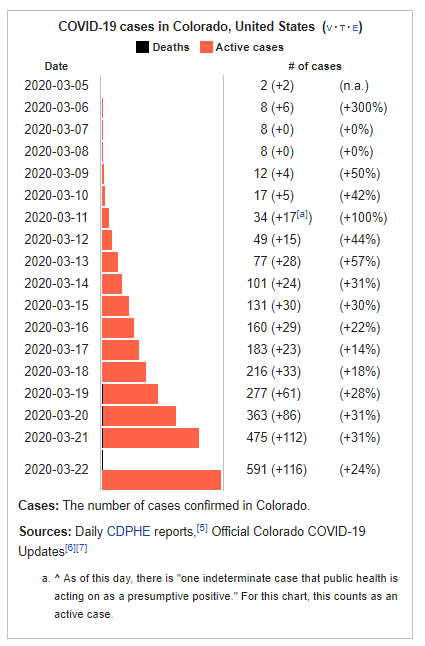
I gathered the data in the following table so that it can be used in this month's problem:
| Day | Cases |
|---|---|
| 0 | 2 | 1 | 8 | 2 | 8 | 3 | 8 | 4 | 12 | 5 | 17 | 6 | 34 | 7 | 49 | 8 | 77 | 9 | 101 | 10 | 131 | 11 | 160 | 12 | 183 | 13 | 216 | 14 | 277 | 15 | 363 | 16 | 475 | 17 | 591 |
Since it appears to be an exponential function, use the data for day #11 (160 cases) and day #15 (363 cases) to solve for A and B in the general exponential function
y = A eB x .
Now take this equation that you just found and let x = 9, then solve for y to see how close the model is to the actual number of cases.
You must show your algebra to get credit.